Quickstart
Three steps: install, analyze, read. No account, no configuration file, and nothing written to disk unless you ask for a report.
1. Install
brew install ast-metrics/tap/ast-metrics
On a PHP project, install it as a dev dependency. If you come from PhpMetrics, this is the familiar route:
composer require --dev ast-metrics/ast-metrics
php vendor/bin/ast-metrics analyze src
Prefix the commands below with php vendor/bin/.
Nothing to install. On a Node.js project, run the analyzer directly:
npx ast-metrics analyze src
The package downloads the binary once and caches it. Prefix the commands
below with npx.
Nothing to install. On a Python project, run the analyzer directly:
pipx run ast-metrics analyze src
The package downloads the binary once and caches it. Prefix the commands
below with pipx run.
curl -fsSL https://install.ast-metrics.dev | sh
Then move the ./ast-metrics binary to a directory in your PATH.
All the other methods (Docker, npm, pip, Linux packages, plain binaries,
go install) are on the installation page.
2. Analyze your project
From the root of any project:
ast-metrics analyze .
The analysis takes a few seconds, then a summary is printed in your terminal: maintainability, bug probability (Halstead), coupling, complexity, size, languages, test quality, lint status, and the hotspots worth refactoring first.
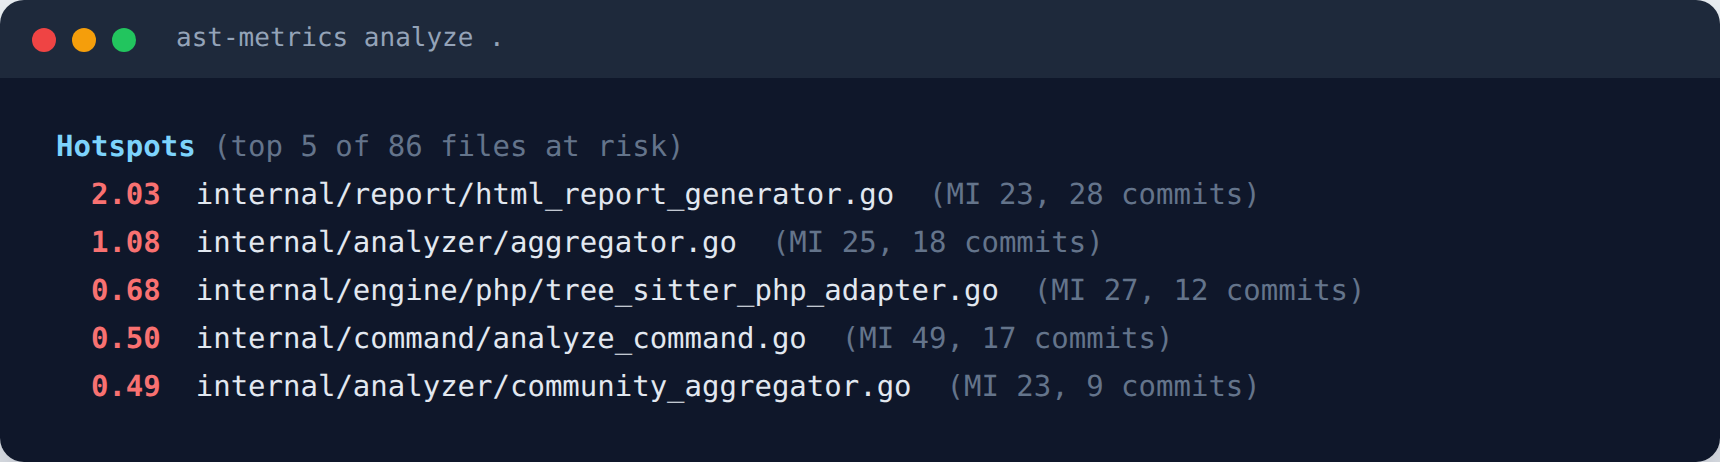
Prefer to explore? Add --tui to open a full-screen interactive dashboard
instead:
ast-metrics analyze --tui .
Navigate with the arrow keys, press Enter to expand a section, Ctrl+F to
search, and Esc or Ctrl+C to quit.
CI-friendly by default
In CI, or when the output is piped or redirected, AST Metrics always prints plain text: no flag needed.
3. Generate an HTML report
ast-metrics analyze --report-html=report .
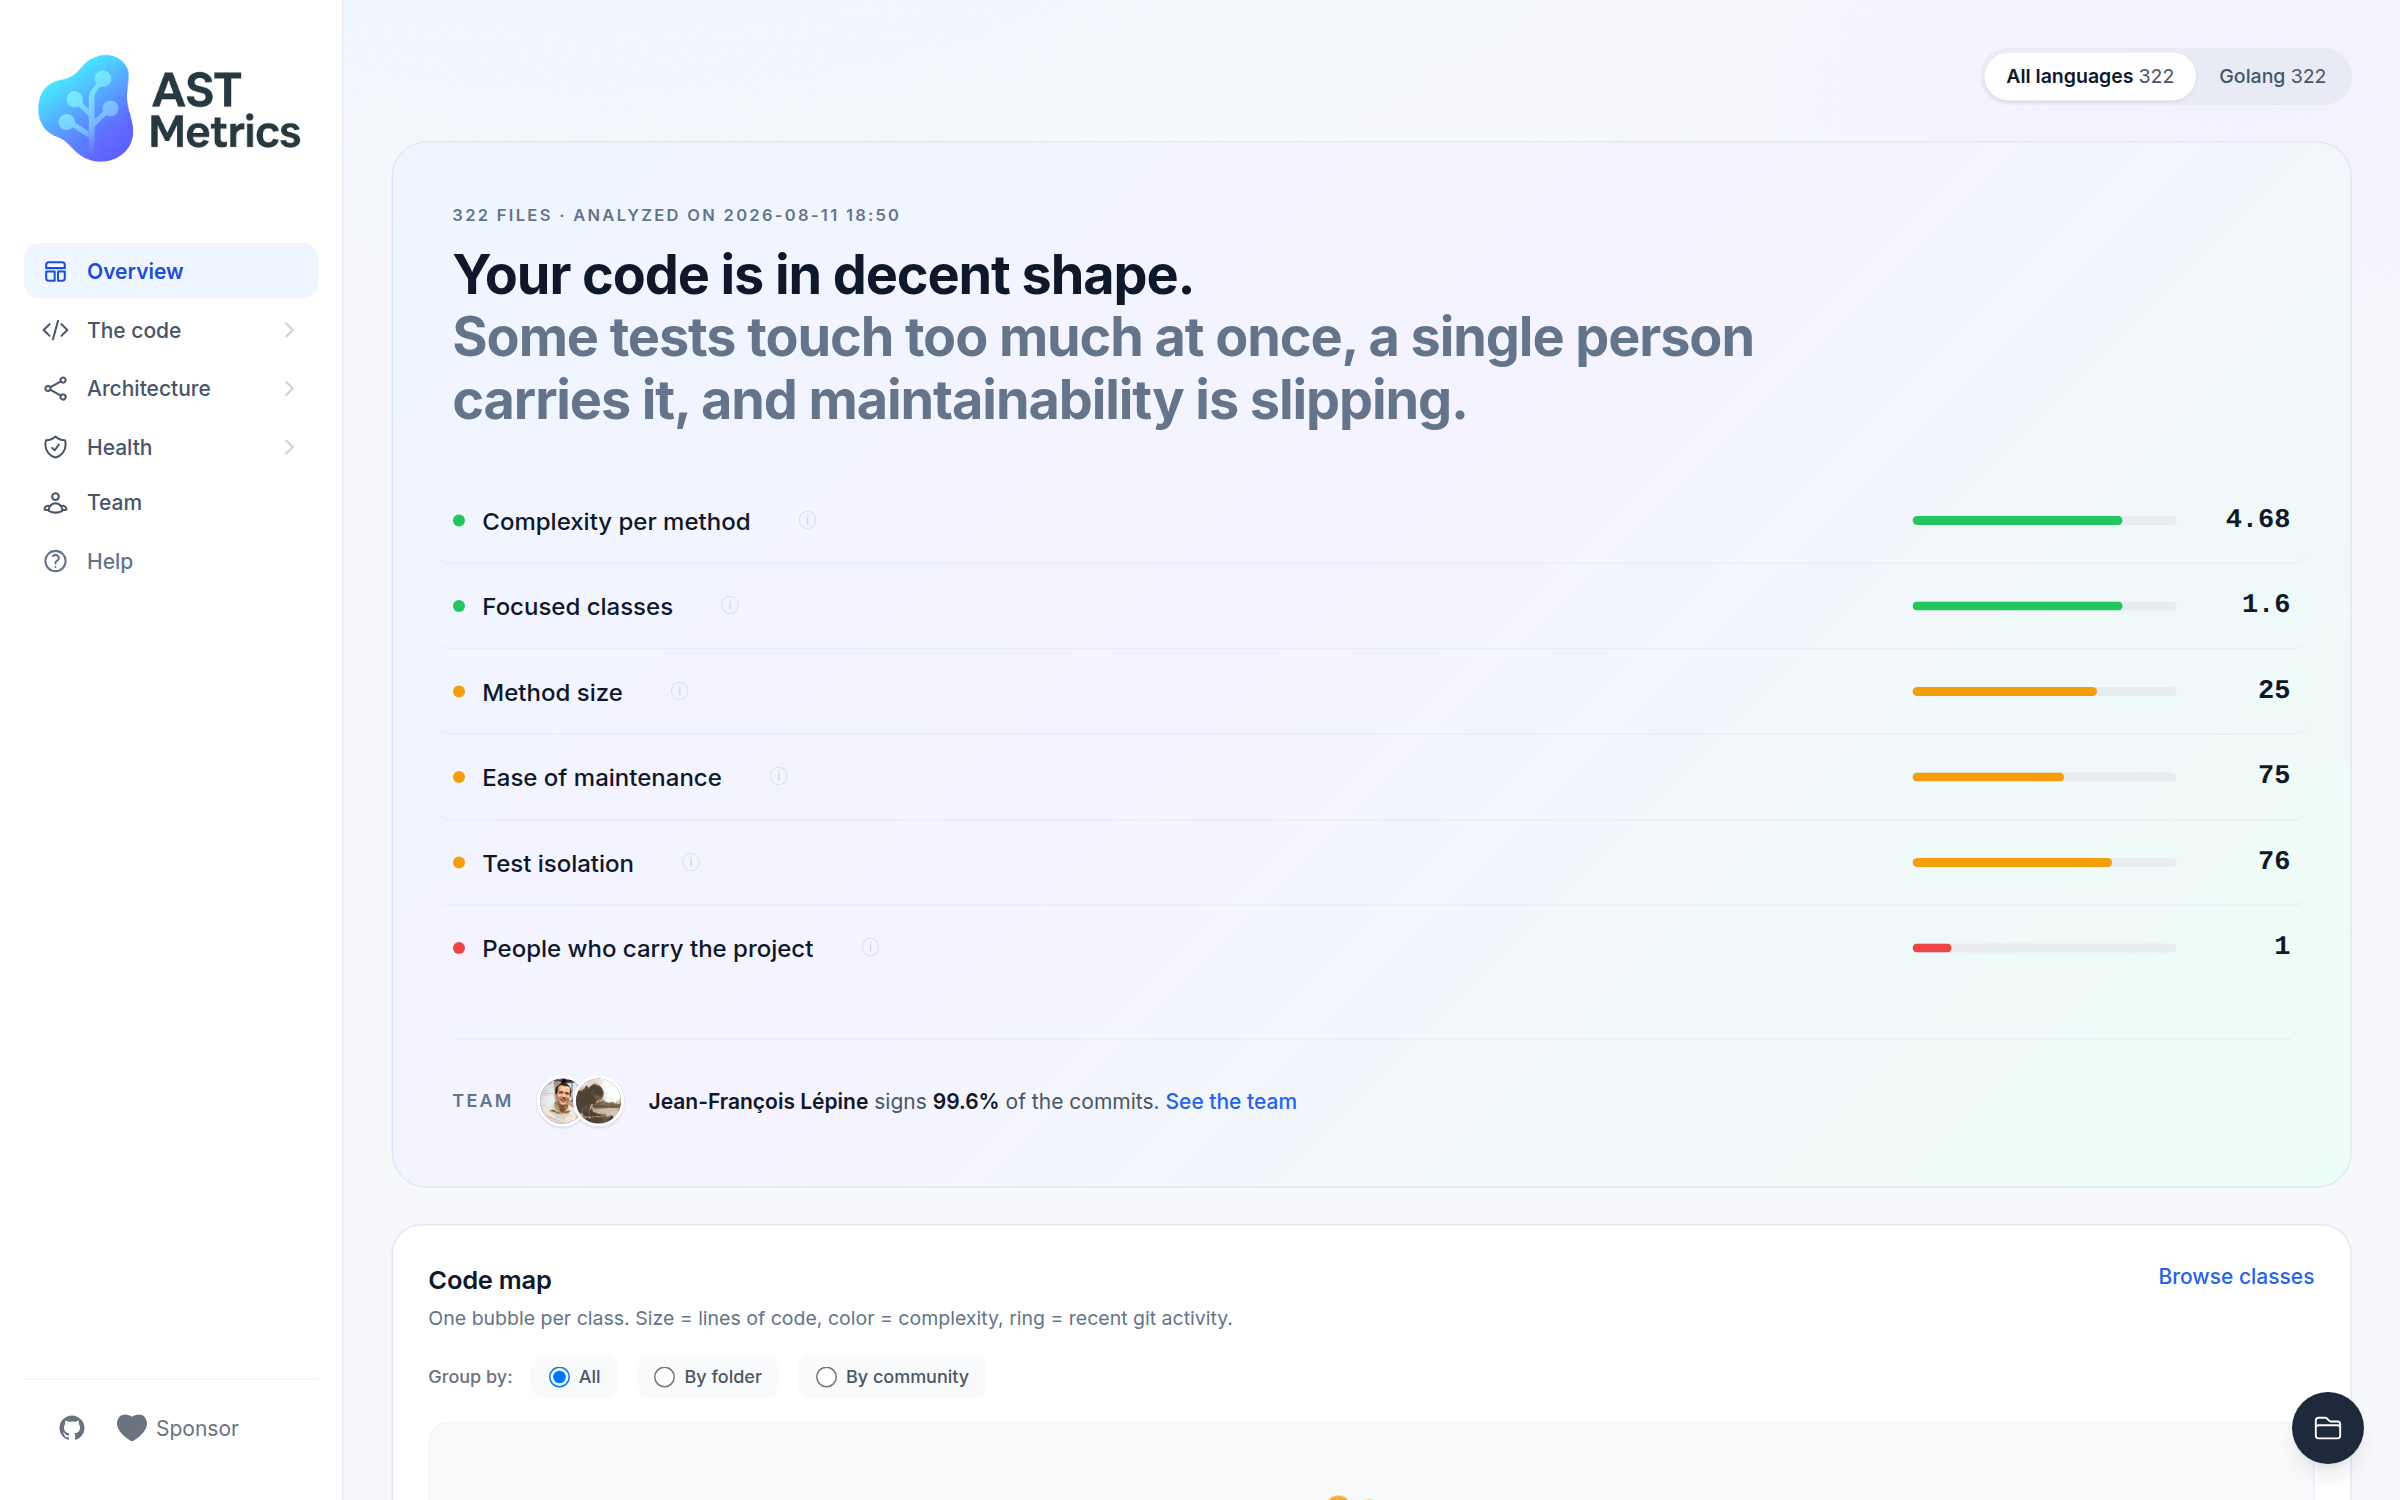
This creates a report directory containing the full analysis, opening with a
plain-language verdict on your codebase. Add --open-html to open it in your
browser right away.
Where to go next
- Tutorial: your first analysis: a guided walkthrough on a real open source project, reading the output number by number.
- Review your changes: compare a branch with its base and report only what you made worse. This is the command to run on pull requests.
- Run it in CI: the GitHub Action needs a single line of YAML.
- Understand the metrics: what the numbers mean, and which ones to act on.
- Enforce rules: complexity budgets, forbidden
dependencies and quality gates in an
.ast-metrics.yamlfile.